Projections are essential for mapping the Earth, and visualizing spatial data in various contexts. For example, you can use them when designing urban infrastructure, reorganizing office spaces, or showcasing construction projects. In this post, we’ll examine how to create and use flat projections with the JavaScript API, what the scale of a map is, and how to get the desired level of detail using tiles.
Cartesian module
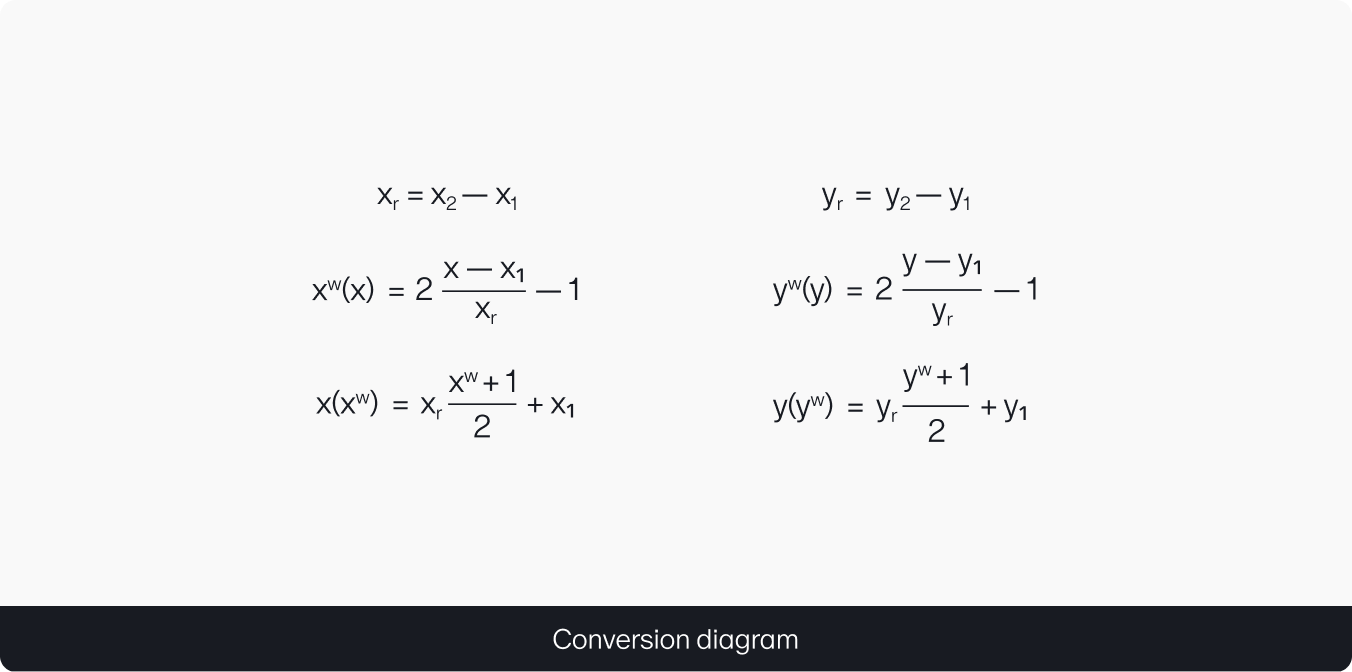
To display arbitrary Cartesian coordinates instead of WGS coordinates, make sure to use the @mappable-world/mappable-cartesian-projection package.
With this package, the map automatically translates your Cartesian coordinates into the JS API World Coordinates System’s coordinates and back, allowing you to work in your preferred reference frame.
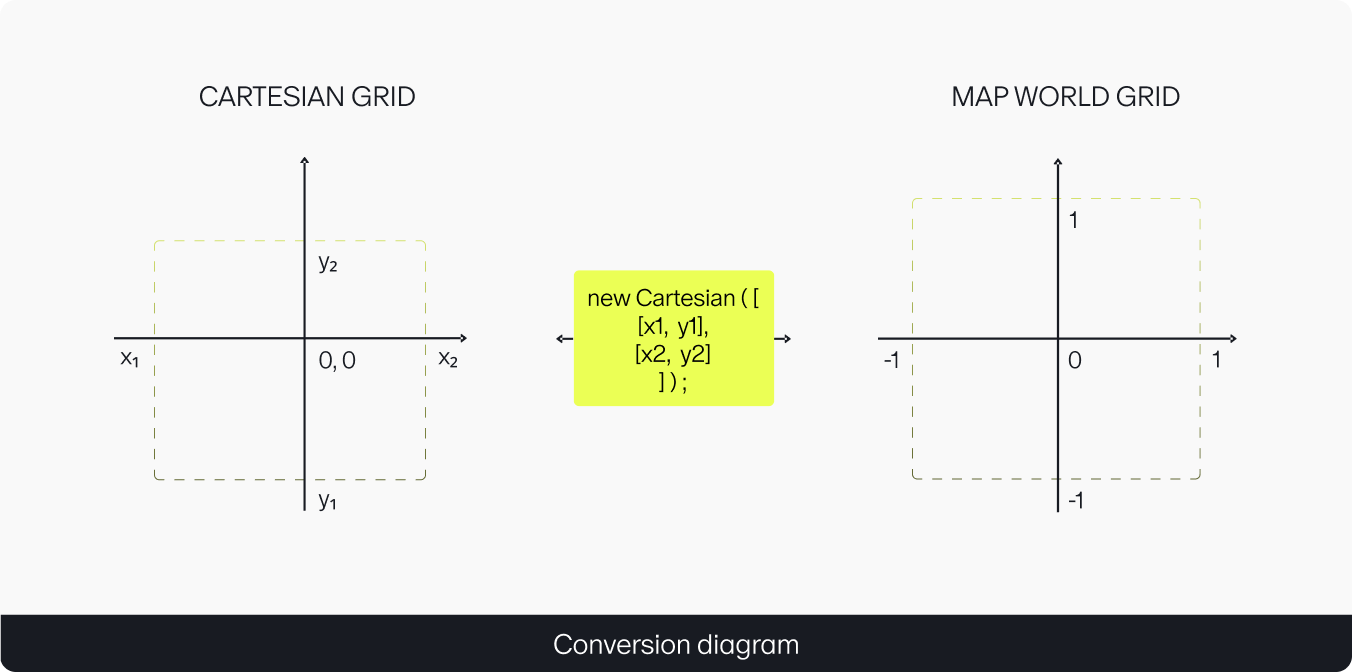
The package exports the Cartesian class, which accepts bounds values in its constructor. This is an array of two points:
The bottom-left point of the valid coordinate plane (the minimum x and y values)
The top-right point of the valid coordinate plane (the maximum x and y values)
Note If you want to display the abscissa and ordinate axes proportionally, specify proportional ranges in bounds. To ensure equivalent display along both axes, the ranges should constitute a square area.
Among other applications, the Cartesian projection allows you to build various graphs. All you need to do is set the equation:
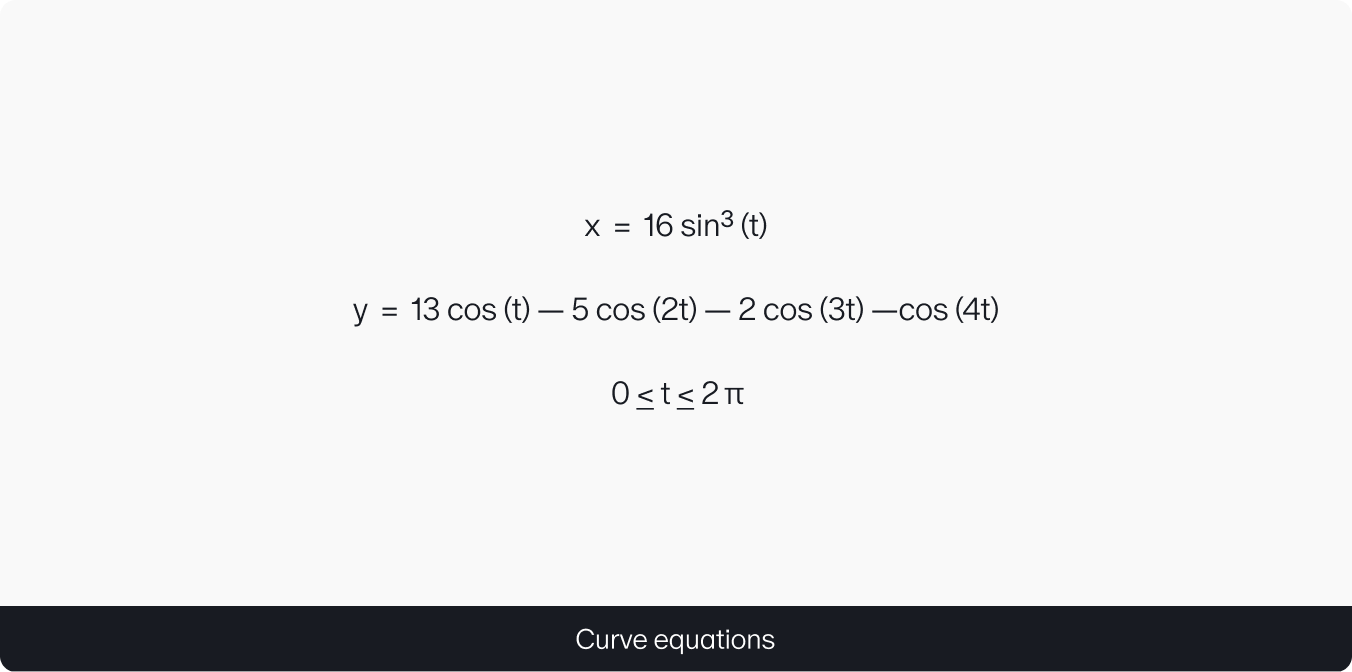
Next, you can render the graphs on the map using the MMapFeature component:
const heartCoords = [];

for (let t = 0; t <= 2 * Math.PI; t += 1e-5) {
    const x = 16 * Math.pow(Math.sin(t), 3);
    const y = 13 * Math.cos(t) - 5 * Math.cos(2 * t) - 2 * Math.cos(3 * t) - Math.cos(4 * t);

    heartCoords.push([x, y]);
}

map.addChild(
    new MMapFeature({
        geometry: {
            type: "LineString",
            coordinates: heartCoords,
        },
        style: {
            stroke: [{ color: "#f66", width: 4 }],
            simplificationRate: 0,
            zIndex: 1000,
        }
    })
);
Scaling
By changing the scale of the map, you can control the level of detail of displayed areas and objects.
Decrease the scale level (zoom out) to display a larger area and see more objects on the map.
Increase the scale level (zoom in) to render objects with more details that weren’t visible before. This can be useful when you need to view a specific object like a building, a road, a river, or other map element.
In map services, the zoom level is controlled by the zoom parameter. This value represents a number from zero to infinity. However, Earth maps rarely offer zoom levels beyond 21, and satellite images can’t produce images with a zoom level higher than 19.
There is a variety of tools and actions that you can use to change the map scale, such as the mouse scroll wheel or dedicated buttons.
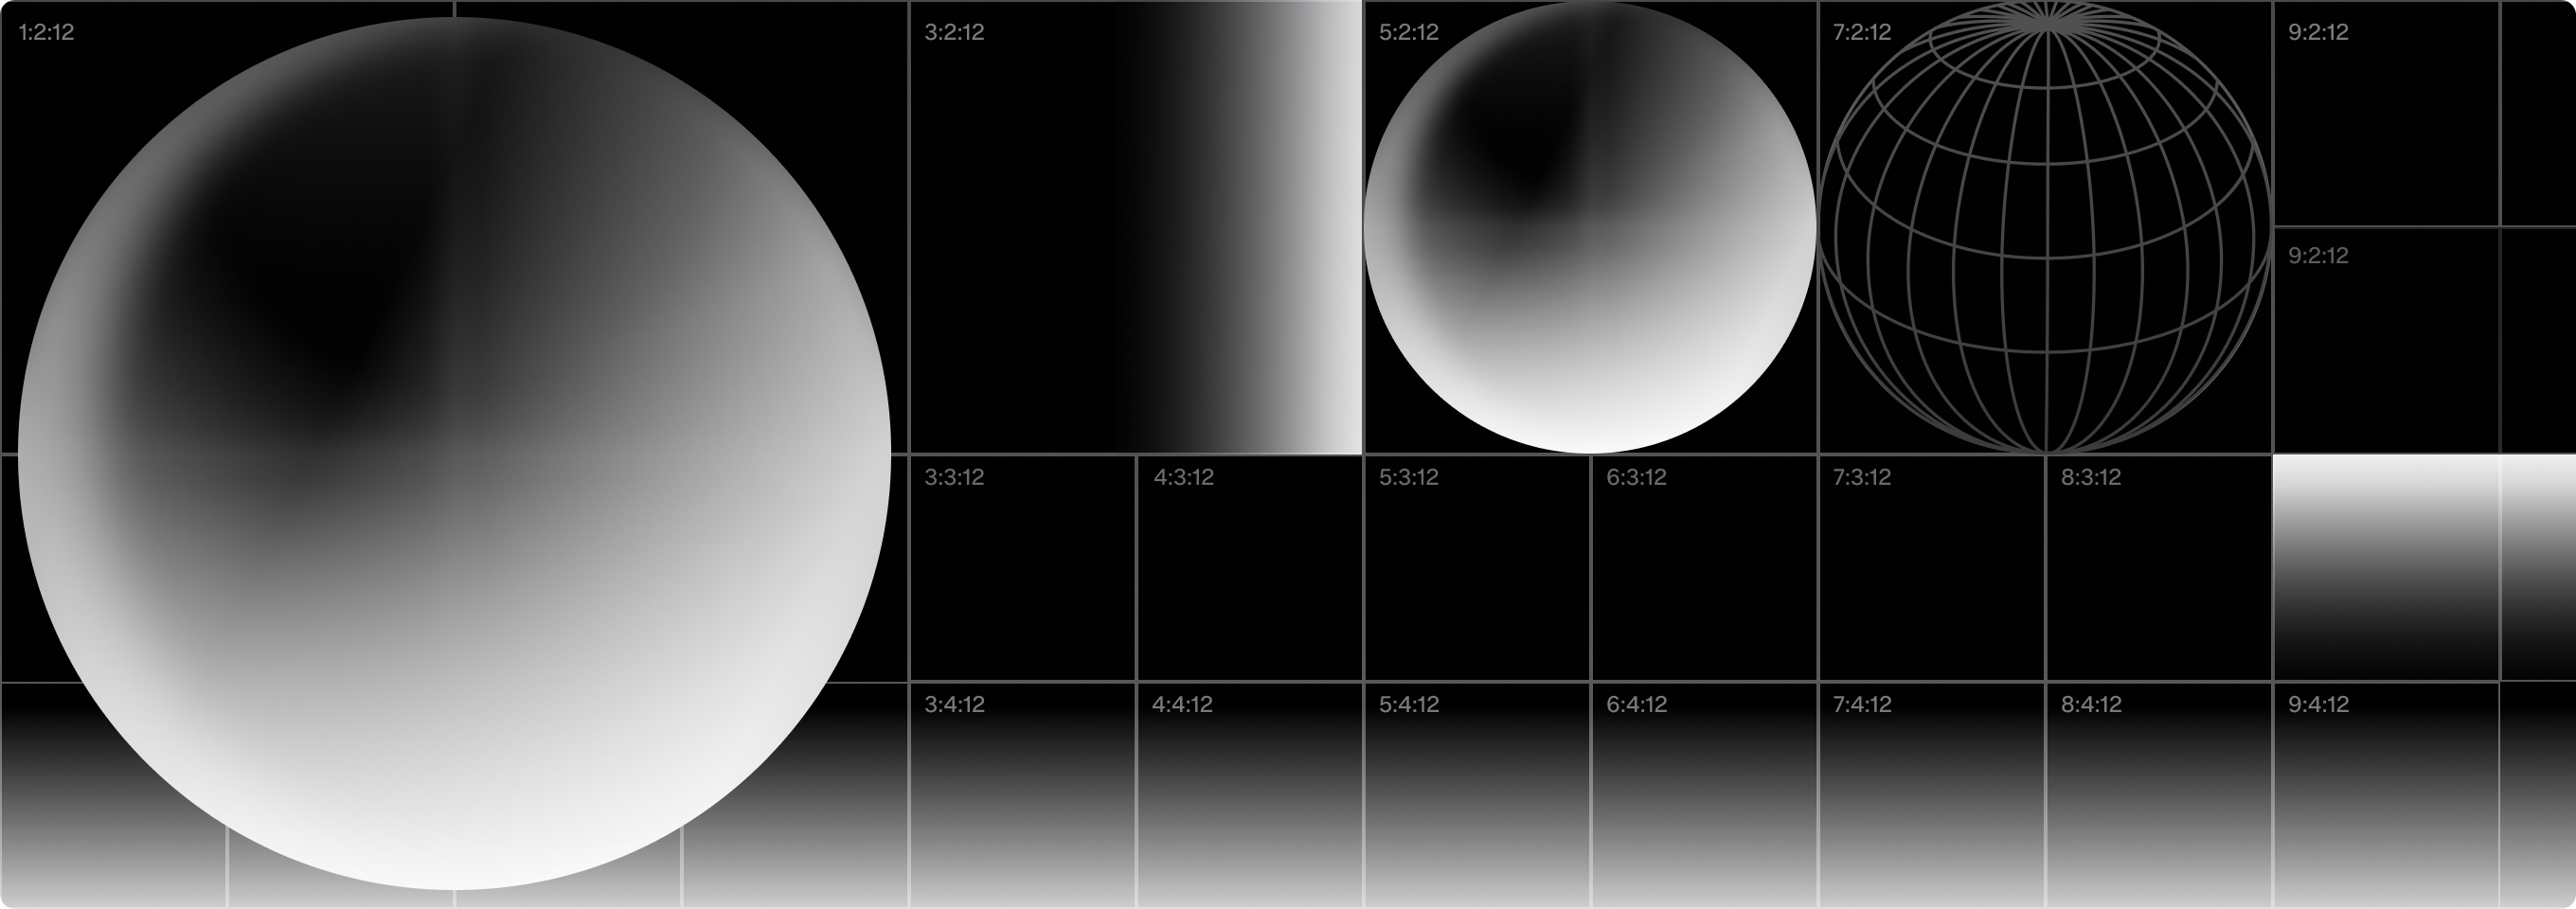
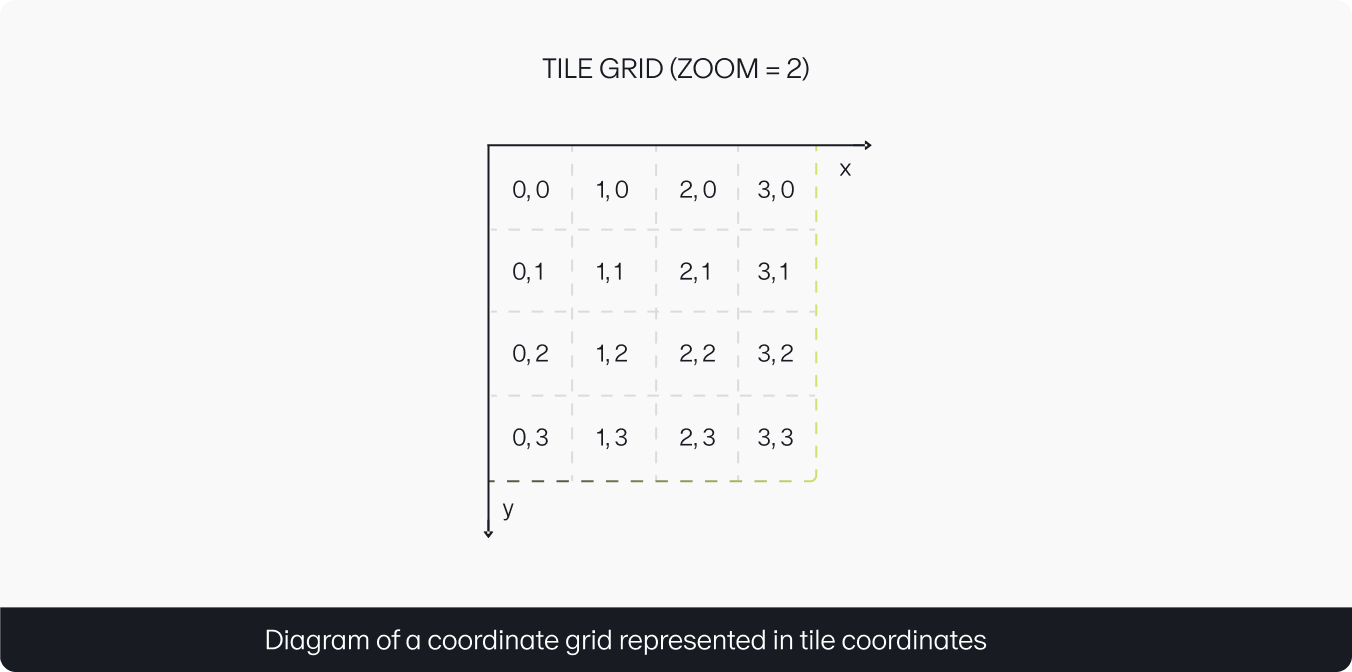
Tile coordinates
To display an image of a large size, you first need to break it into tiles. These are squares of the same size (usually 256 × 256 pixels) that can be reassembled into a portion of the source image. They have a small file size and take less time to load and render on a device.
To build a seamless image of the map from tiles, you need to organize and divide them by level of detail. Each scale level should have its own set of tiles.
The resulting tiles have the following coordinates:
x: Horizontal tile index on the grid, from the leftmost (0) to the rightmost (2^zoom – 1).
y: Vertical tile index on the grid, from the topmost (0) to the bottommost (2^zoom – 1).
z: Zoom level.
Pixel coordinates
After implementing tile coordinates, you can also make calculations for individual pixels on the screen, known as pixel coordinates. They directly depend on the size of your tiles. For instance, if a single tile is 256 × 256 pixels, then the pixel grid will fall within the range between 0 and 256 zoom.
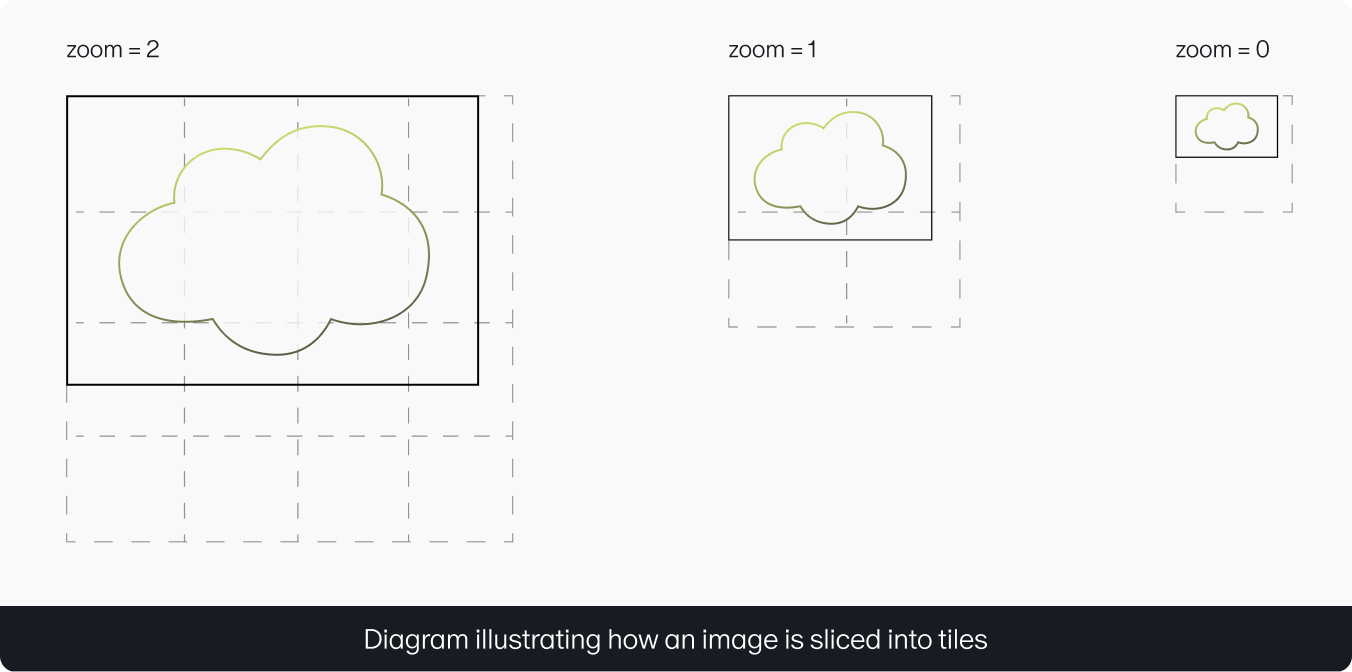
Slicing an image into tiles
Using the @mappable-world/mappable-tiles-generator utility, you can break a large image into tiles to significantly increase its load speed and allow changing the zoom level and viewing individual parts of the image.
The utility works in combination with @mappable-world/mappable-cartesian-projection. By default, it prepares the map parameters needed to work with image pixels.
The image is too large to display on the user’s device in all its details, so it needs to be split into smaller fragments.
Let’s call the utility to slice it into tiles:
npx @mappable-world/mappable-tiles-generator --s ./image.png --d ./tiles
This command generates images with a total size of approximately 140 MB. However, each individual image is now small in size (about 135 KB) and can be loaded in parallel. Furthermore, the original image is now split into seven levels of detail (0 to 5), each with its own set of tiles.
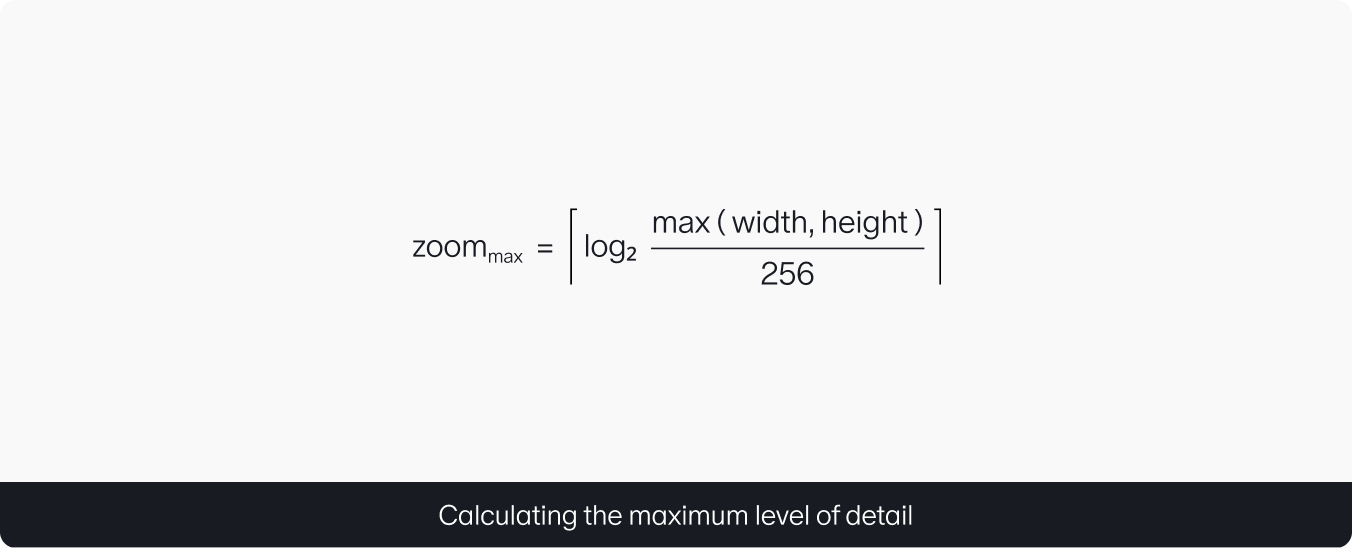
For pixel-perfect rendering at the highest level of detail, find the minimum zoom level where the image completely fits the pixel coordinate grid:
Next, for each level of detail, slice the image into pieces matching the appropriate tile size. The lower your zoom value, the more the image will fit into a tile. At minimum zoom level (zoom = 0), the entire image fits into a single tile.
You can now upload the generated tiles to any CDN and display them on the map:
const projection = new Cartesian(params.projection.bounds);
map = new MMap(document.getElementById("app"), {
    ...params.map,
    location: { center: [0, -800], zoom: 1.5 },
    projection
});
map.addChild(new MMapTileDataSource({
    id: "image",
    copyrights: ["Public domain"],
    raster: {
        type: "tile",
        fetchTile: `https://yours-cdn.com/tiles/${params.tiles.pathTemplate}`,
    }
}));
map.addChild(new MMapLayer({ source: "image", type: "tile" }));
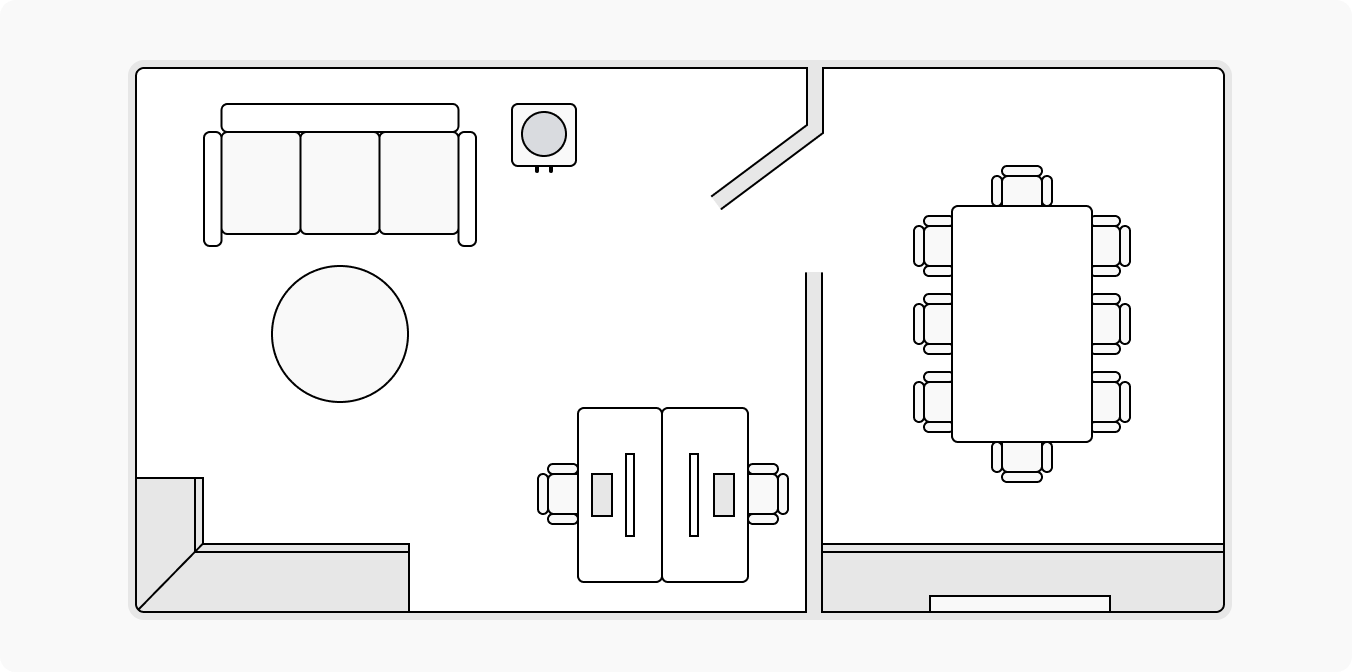
What about office maps?
You can do the same thing with office maps if you have an image and link to some real-world physical value (for example, the ratio of pixels to meters).
Let’s take a picture of an office floor plan. It’s also highly detailed, so we’ll run it through the tile-generation utility:
npx @mappable-world/mappable-tiles-generator -s ./office-interior.jpg -d ./tiles
Then all we now need to do is adjust the parameters generated by the tool by adding the offset, and dividing by the pixel-to-meter ratio.
const CENTER_PX_OFFSET = [9, 0];
const PX_TO_METERS = [350, 350];
function convertPixelsToMeters(bounds) {
    return bounds.map(([lng, lat]) => [
        (lng + CENTER_PX_OFFSET[0]) / PX_TO_METERS[0],
        (lat + CENTER_PX_OFFSET[1]) / PX_TO_METERS[1]
    ]);
}
And then we can create beauty: put in tables, rooms, office equipment, seats for staff, and integrate the staff calendar.
With the JavaScript API, you can work with traditional maps and WGS coordinates and also with images based on Cartesian coordinates. For example, you can use our API when you need to display a section of space measured in parsecs or a part of a building represented in meters.
MAX PIN, JS API developer