
People search for all kinds of things on the internet: tourist attractions, landmarks, pharmacies nearby, places to relax, or how many planes are in the sky right now. All this information can actually be displayed on a map of the world, country, or city.
It’s a natural fit, since a map isn’t just a representation of our surroundings but also a canvas for showcasing information. Then again, when the number of objects to display reaches a certain threshold, the classic problem of data visualization comes in.
What’s the problem?
There aren’t any issues at first. To start off with an easy example, here are the rough steps to finding a nearby pharmacy:
- Open a navigation app.
- Type “pharmacy” in the search bar.
- See several pharmacies close by.
- Choose the nearest one and head there.
In this case, everything is pretty straightforward. But what if there’s a hundred pharmacies nearby, or a thousand. Or even ten thousand? What would the map look like then? Probably very cluttered and completely invisible under the multitude of points on it.
A couple more complications arise:
To display all these thousands of objects and their metadata, megabytes of data would have to be loaded from the server to the phone. That would take a while, to put it lightly.
Since the map would show thousands of points overlapping each other, there really is no way to tell which is the closest. The user would have to zoom in on the map, try to make sense of all this chaos, and estimate the distance to each place by eye. Not exactly convenient.
The map interface would probably lag, because the browser would be too busy constantly updating the DOM tree.
When a search query returns too many objects, the map becomes too difficult to use. In this article, we’ll talk about how to display a large number of points on a map, the associated difficulties, and effective solutions.
Everything everywhere all at once
Now, let’s examine the problem a little more closely. Below is a code sample that can be used to display a thousand points with random coordinates on a map:
const {MMap, MMapMarker} = mappable;
const count = 1000;
const markers = getRandomMarkers(count);

for (let i = 0; i < count; i += 1) {
    map.addChild(new MMapMarker({...markers[i]}));
}

function getRandomMarkers(count) {
    const markers = [];
    const element = document.createElement('div');
    element.className = 'marker';
    for (let i = 0; i < count; i += 1) {
        markers.push({
            id: `m${i}`,
            coordinates: [Math.random() * 180 - 90, Math.random() * 360 - 180],
            element: element.cloneNode()
        });
    }
    return markers;
}
Note The code was written using the Javascript API. To learn how to add the JS API to a project and how to initialize the map, see Connecting the API.
Feel free to test this interactive snippet on different devices:
This demonstrates that as the number of points increases, the interface slows down and becomes unresponsive. A thousand points would make it completely unusable.
Why does the interface slow down?
Each marker on a map is a separate DOM element. Every time a map event is triggered (for example, dragging the map or zooming in and out), the JS API calculates a new position for each DOM element in the container and re-renders it.
These recalculations trigger a reflow of all the elements on the map. The more elements there are, the longer this is going to take. For example, Google recommends using a maximum of 1500 DOM elements per page.
But what if that’s not enough?
Possible solutions
Under normal circumstances, no one really needs to see thousands of points on the map all at once. They create clutter on a zoomed-out map, and only a handful of them are visible when the map is zoomed in.
Removing points outside the visible area
The ideal solution is to only display the points that are relevant to the user at any given moment.
To do this, front-end developers often use the VirtualScroll pattern. It only renders the DOM elements that are visible in the browser window, removing all the rest.
This requires the geographic coordinates of the lower-left and upper-right corners of the map section, as well as the point coordinates. Then it’s only a matter of removing the DOM elements of the points that are outside this area:
type Point = [number, number];

function isInBounds(point: Point, bounds: [Point,  Point]): Boolean {
    const [x, y] = point.coordinates;
    const [x1, y1] = bounds[0];
    const [x2, y2] = bounds[1];
    return x >= x1 && x <= x2 && y >= y1 && y <= y2;
}
This function was written in TypeScript but can be implemented in pure JavaScript as well.
Below is a React code snippet that shows how to call this function for each point:
const {MMap, MMapListener, MMapMarker} = mappable;

const LOCATION = {center: [25, 55]};
const INITIAL_BOUNDS = [[24,54], [26,56]];

const points = [
    [25.22, 55.28],
    [25.26, 55.38],
    [24.99, 55.45]
];

function App() {
    const map = React.useRef();
    const [bounds, setBounds] = React.useState(INITIAL_BOUNDS);
    const onChange = useCallback(() => setBounds(map.current.bounds), []);
    return (
        <MMap ref={map} location={LOCATION}>
            <MMapListener onUpdate={onChange} />
            {points
                .filter((p) => isInBounds(p, bounds))
                .map((p) => (
                    <MMapMarker key={p.coordinates.join(',')} {...p} />
                ))}
        </MMap>
    );
}
Run the following interactive snippet and try changing the number of points. Take note of how it affects the FPS. If the zoom value stays the same, the number of points has almost no effect on the performance.
Note Writing all this code every time is rather tedious, and that’s why the JS API comes with the hideOutsideViewport option for MMapMarker.
This approach is effective at high zoom levels. The map displays only the points visible to the user and removes the rest.
This is convenient because all changes are made in JS without the reflow and repaint of the non-visible DOM elements. It’s actually similar to the VDOM concept.
However, this approach does have a couple of obvious disadvantages:
- Iterating over an array that contains hundreds of thousands of elements. This alone is enough to freeze the browser.
- When a user zooms all the way out to see the entire map, there are no markers to remove. All of them show up at once.
There are some workarounds, of course. Limiting the zoom level to prevent users from zooming out to world view and seeing too many markers simultaneously could fix the second problem. After all, why display all pharmacies across the country when only the ones located in the user’s neighborhood are relevant?
Here’s how to prevent the user from zooming out past level 9 on the map:
<MMap zoomRange={{min: 9, max: 21}} location={LOCATION}>
    {/*...*/}
</MMap>
Feel free to try out this interactive snippet:
But what if the map needs to be rendered at the furthest zoom level? This requires a fundamentally different approach.
Clusterer
In the JS API, a cluster refers to a special map marker that combines several other markers that share a certain characteristic.
Imagine a 10×10-pixel map section containing seven markers. Due to overlap, it becomes impossible for users to click on the individual points. But what if they’re grouped into a single cluster marker? Clicking on it zooms in, separating the cluster into seven distinct markers for easier interaction.
This can be implemented as shown below. Cluster markers show up at zoom level 12, while at higher zoom levels, they’re split into individual markers:
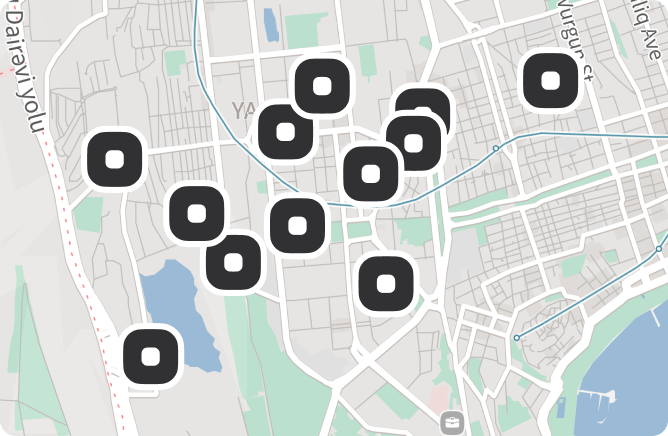
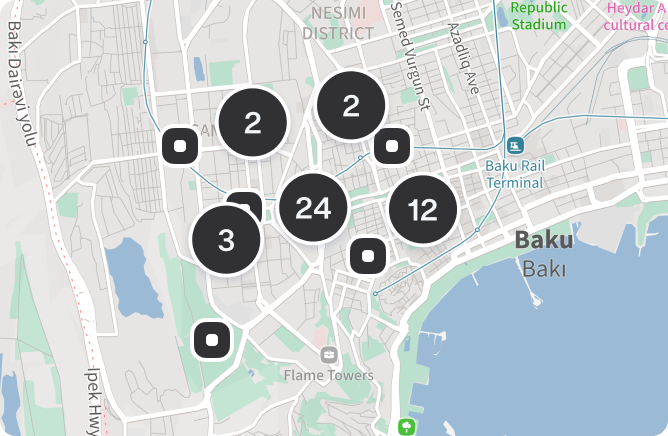
Several points located within an area of a certain size get merged into one. The clusterer automatically determines whether the points should be visible at the current scale and either adds or removes them from the map.
const {MMapClasterer} = await mappable.import('@mappable-world/mappable-clusterer@0.0.1');

const gridSize = 64; // cell size, in pixels

const clusterer = new MMapClasterer({
    method: clusterByGrid({gridSize}),
    points: markers,
    cluster: (coordinates, features) => new mappable.MMapMarker({...}),
    marker: (feature) => new mappable.MMapMarker({...})
});
Note This is possible for any cell size, including 64, 128, 256, and so on. When the cells are larger, more points are combined into a single cluster, resulting in fewer markers appearing on the map. See MMapClusterer.
Use this interactive snippet to see how it works:
Now, regardless of the zoom level, the map won’t be cluttered with an excessive number of markers and their associated DOM elements. To add to that, the density of the points can be adjusted manually.
The clusterer can easily handle up to 50,000 map points. However, just like with the previous method, the clusterer has to analyze all the map points again when the map is moved or zoomed in or out. So if there are too many points, this can slow down the interface.
Try both approaches and compare:
Loading data
There’s also the issue of efficient data loading. After all, a point on the map is more than its coordinates. It also contains additional information known as metadata. This includes details like the point’s name, address, rating, number of reviews, and so on. All this information needs to be loaded without hindering performance.
Have a look at the benchmark below which measures the time needed to load a 1.5 MB JSON file from the server on different networks.
Calculation code:
(() => {
    let time = new Date().getTime();
    const dataLink = 'https://d2ad6b4ur7yvpq.cloudfront.net'
        + '/naturalearth-3.3.0/ne_50m_rivers_lake_centerlines_scale_rank.geojson?t='
        + Math.random() + '_' + time;

    fetch(dataLink)
        .then((res) => res.text())
        .then((text) => {
            console.log('fetch time: ', new Date().getTime() - time);
            time = new Date().getTime();
            const data = JSON.parse(text);
            console.log('parse time: ', new Date().getTime() - time);
        });
})();
Note While the results of this benchmark aren’t meant to be representative, they do highlight that loading and processing data can be time-consuming.
Loading times on different devices and networks:
| Network | Loading time |
|---|---|
| 3G | 14 seconds |
| 4G | 4 seconds |
| Wired connection | 1 seconds |
Calling the JSON.parse method to process data of the same size:
| Device | Parse time |
|---|---|
| iPhone 6 | 1 seconds |
| iPhone XR | 0.5 seconds |
| Macbook M1 Pro | 0.015 seconds |
| Realme 7 PRO | 0.5 seconds |
In a real project, the server also requires time to handle a data request, generate a response, and send it to the client. On the client side, data isn’t only loaded and deserialized — it also needs to be processed, converted into API objects, and displayed on the map. All this extra time has to be considered.
In 2010, Dr. Jeff Dean from Google cited these latency values:
| Time, ns | |
|---|---|
| Compress 1 KB with Zippy | 10,000 |
| Send 2 KB over a 1 Gbps network | 20,000 |
| Read 1 MB sequentially from memory | 250,000 |
| Perform a disk seek | 10,000,000 |
| Read 1 MB sequentially from network | 10,000,000 |
| Read 1 MB sequentially from disk | 30,000,000 |
| Send a packet CA->Netherlands->CA | 30,000,000 |
A lot has changed since then, but the overall picture is mostly the same. The clusterer can assist with rendering thousands of objects, but what about millions? For example, a map that shows the entirety of North America and all of the country’s post offices with their names. The clusterer would take quite a bit of time to process all of them and then display 10 points on the map, each showing the number of post offices it includes. To add to that, calculations would renew every time the map state changes:
for (i = 0; i < 1000000; i++) {
    processPoint(p[i]);
}
That’s a bit too much time.
This circles back to the point that in most cases, people don’t need to see all the map markers at once. Instead, it’s more useful to figure out which data the user needs at a given moment and load only that information.
Two strategies can help here:
BBOX — data loads only for the visible section of the map.
TILES — the map is divided into evenly sized squares (tiles), and data loads individually for each visible tile.
The BBOX strategy
In the picture below, the gray area is hidden from the user so there’s no point in loading the data inside it:
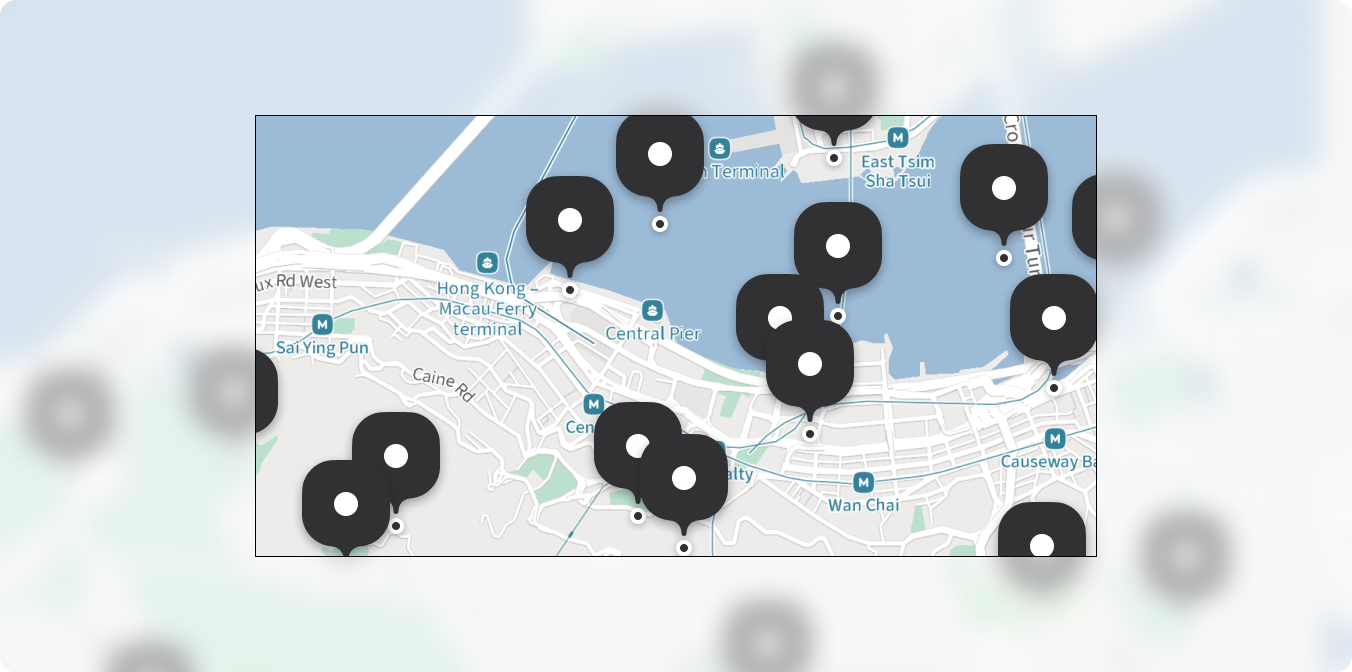
Data loading can be limited to the area between the lower-left and upper-right corners of the map section. It’s called the “bounding box,” often shortened to “bounds” or “bbox”.
Here’s how to expand the code used to remove the points that fall outside the visible map section by sending the bbox to the server:
import debounce from 'lodash.debounce';

const {MMap, MMapListener, MMapMarker} = mappable;

const LOCATION = {center: [25, 55]};
const INITIAL_BOUNDS = [[24,54], [26,56]];

function App() {
    const map = React.useRef();
    const [bounds, setBounds] = React.useState(INITIAL_BOUNDS);
    const [points, setPoints] = React.useState([]);

    useEffect(async () => {
        const points = await fetch('https://api.test.service/?bound=' + bounds.toString())
            .then((res) => res.json());
        setPoints(points);
    }, [bounds]);

    // Don't request new points too often
    const onChange = useCallback(
        debounce(() => setBounds(map.bounds), 100),
        []
    );

    return (
        <MMap ref={map} location={LOCATION}>
            <MMapListener onUpdate={onChange} onResize={onChange} />
            {points.map((p) => (
                <MMapMarker key={p.coordinates.join(',')} {...p} />
            ))}
        </MMap>
    );
}
The debounce pattern helps to avoid overloading the server and accidentally causing a self-inflicted DDoS attack.
Here’s how it works:
Server-side BBOX implementation
An example of a server-side implementation of this strategy is available as a Node.js test fixture using the Express framework and a PostGIS database:
Here’s how to create a table for storing map points:
CREATE EXTENSION IF NOT EXISTS postgis;
CREATE TABLE points (
    uid uuid DEFAULT gen_random_uuid() NOT NULL,
    coordinates geography(POINT, 4326) NOT NULL,
    feature json NOT NULL
);

# Index for searching by coordinates
CREATE INDEX global_points_gix ON points USING GIST ( coordinates );
This code shows how to search for points within the BBOX
SELECT * FROM points
WHERE ST_Intersects(coordinates, ST_MakeEnvelope(lng1, lat1, lng2, lat2));
Note This approach is very network-dependent, relying on preloading and caching optimizations. While this isn’t implemented in the test server, an actual app will need to cache data between requests.
Example of a server-side BBOX implementation
The tiles strategy
The previous strategy is effective, yet it has issues. At first, the user doesn’t see any map points, but then they appear all at once.
There’s a way to minimize this delay by splitting the area of the map where the data is loaded into small tiles of 2^N × 2^N (32, 64, 128…) pixels in size. The data then loads individually for each tile rather than the entire map.
With this approach, data only loads for the tiles that are visible or partially visible. This is convenient, because if the user starts dragging the map, they’ll see the pre-loaded points with no delay.
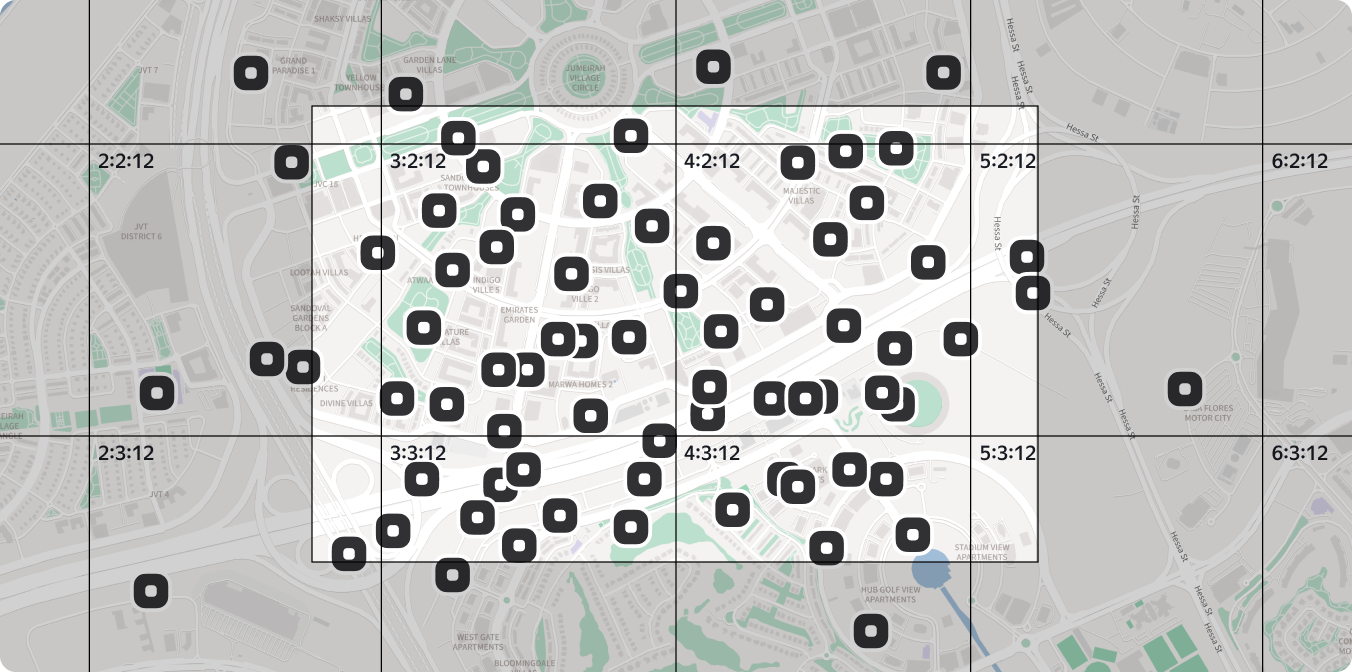
Here’s what it looks like. The tiles that are being loaded are highlighted in yellow. When the viewport moves, the map immediately loads the new tiles:
The server-side implementation of the strategy is pretty similar to the bbox example, except in this case, the server receives three values:
X — the tile’s x-coordinate as an integer
Y — the tile’s y-coordinate as an integer
Z — the map’s zoom level
The coordinates are calculated on the client side and then inverse-transformed on the server side.
The map can be split into as many tiles as needed. The only thing to keep in mind is that the tile size on the server and the client side has to be the same, otherwise the method won’t work correctly.
Here’s an example of map tiling on the client side:
import {LngLat, PixelCoordinates, Projection} from '@mappable-world/mappable-types';
import {PixelCoordinates} from '@mappable-world/mappable-types';

export const computeTileBounds = (
    pixelCenter: PixelCoordinates,
    viewportSize: PixelCoordinates,
    scale: number,
    tileSize: number
) => {
    const halfViewportSize = {x: viewportSize.x / (2 * scale), y: viewportSize.y / (2 * scale)};

    let topLeftTile = {x: pixelCenter.x - halfViewportSize.x, y: pixelCenter.y - halfViewportSize.y};
    topLeftTile = {x: topLeftTile.x / tileSize, y: topLeftTile.y / tileSize};
    topLeftTile = {x: Math.floor(topLeftTile.x), y: Math.floor(topLeftTile.y)};

    let bottomRightTile = {x: pixelCenter.x + halfViewportSize.x, y: pixelCenter.y + halfViewportSize.y};
    bottomRightTile = {x: bottomRightTile.x / tileSize, y: bottomRightTile.y / tileSize};
    bottomRightTile = {x: Math.floor(bottomRightTile.x), y: Math.floor(bottomRightTile.y)};

    return {
        minX: topLeftTile.x,
        minY: topLeftTile.y,
        maxX: bottomRightTile.x,
        maxY: bottomRightTile.y
    };
};

export function getTilesForViewport({
    projection,
    zoom,
    center,
    tileSize,
    size
}: {
    readonly projection: Projection;
    readonly zoom: number;
    readonly center: Readonly<LngLat>;
    readonly tileSize: number;
    readonly size: PixelCoordinates;
}) {
    const roundZoom = Math.floor(zoom);
    const scale = 2 ** (zoom - roundZoom);
    const worldCenter = projection.toWorldCoordinates([...center]);
    const worldPixelSize = 256;
    const pixelScale = (2 ** roundZoom / 2) * worldPixelSize;
    const pixelCenter = {x: (worldCenter.x + 1) * pixelScale, y: (1 - worldCenter.y) * pixelScale};
    const viewportTileBounds = computeTileBounds(pixelCenter, size, scale, tileSize);
    const result = [];
    for (let tx = viewportTileBounds.minX; tx <= viewportTileBounds.maxX; tx++) {
        for (let ty = viewportTileBounds.minY; ty <= viewportTileBounds.maxY; ty++) {
            result.push({tx, ty, tz: roundZoom});
        }
    }

    return result;
}
Next, the following request is sent to the server:
const tiles = getTilesForViewport({
    projection: map.projection,
    zoom: map.zoom,
    center: map.center,
    tileSize: 256,
    size: map.size
});

for (const tile of tiles) {
    fetch(`https://api.test.service/?tile=${tile.tx}_${tile.ty}_${tile.tz}`)
        .then((res) => res.json())
        .then((points) => {
            // points can be displayed on the map
        });
}
Example of server-side TILES implementation
The client part is not so simple this time, a separate package has been made for this https://mappable-world.github.io/mappable-entity-tile-loader.
Next, the following request is sent to the server:
const {MMapFeature, MMapDefaultFeaturesLayer} = mappable;
const {MMapEntityTileLoader} = await mappable.import('@mappable-world/mappable-entity-tile-loader@1.0.0');

map.addChild(new MMapDefaultFeaturesLayer());

const tileSize = 256; // Server-side conversions should also adhere to this size

map.addChild(
    new MMapEntityTileLoader({
        /**
         * By default, old points get deleted immediately upon changing tiles
         * However, the new tile may contain the same points,
         * in which case there's no point in deleting them
         * Set the delay for applying deletion operations
         */
        removalDelay: 500,

        tileSize,
        getFeatureId: (feature) => feature.id,
        fetchTile: ({tx, ty, tz, sginal}) => {
            return fetch(`https://geodata.example/${tx}/${ty}/${tz}?tileSize=${tileSize}`, {signal})
                .then((r) => r.json());
        },

        entity: (feature) =>
            new MMapFeature({
                id: feature.id.toString(),
                geometry: feature.geometry,
                properties: feature.properties
            }),

        onFeatureAdd: (feature) => {
            console.log(feature);
        },

        onFeatureRemove: (feature) => {
            console.log(feature);
        }
    })
);
Note Like MMapClusterer, MMapEntityTileLoader serves as a proxy object that automatically determines which data is currently relevant.
Clusterer + tile-based loading
Combining the clusterer and the tile-based approach is another viable option. All the logic can be moved to the server side by:
- Merging all the points within the same tile into one.
- Informing the client that this point is a cluster.
The only challenging part of this solution is finding the mean coordinates for all the points within the tile.
To do this:
- Find the most distant pair of points within the tile and calculate their midpoint. The midpoint encompasses all the points within the tile.
- Calculate the mean coordinates of all points within the tile. Use the results to place the midpoint closer to the main bulk of points.
Finding the most distant pair of points
function tileClusterer(features, {tx, ty, tz}) {
    // Define the threshold after which the points form a cluster
    if (features.length < 3) {
        return features;
    }

    // Find the bounding box containing all of the points
    const [leftBottom, rightTop] = features.reduce(
        (bounds, point) => {
            const [lng, lat] = point.geometry.coordinates;
            return [
                [Math.min(bounds[0][0], lng), Math.max(bounds[0][1], lat)],
                [Math.max(bounds[1][0], lng), Math.min(bounds[1][1], lat)]
            ];
        },
        [
            [Infinity, -Infinity],
            [-Infinity, Infinity]
        ]
    );

    // Return a regular point to the client, with properties.count being
    // the only indication that it should be displayed as a cluster
    const clusterFeature = {
        id: `cluster-${tx}-${ty}-${tz}`,
        type: 'Feature',
        geometry: {
            type: 'Point',
            coordinates: [(leftBottom[0] + rightTop[0]) / 2, (leftBottom[1] + rightTop[1]) / 2]
        },
        properties: {
            count: features.total,
            minMax: [leftBottom, rightTop],
            features
        }
    };

    return [clusterFeature];
}
On the client side, check the properties.count variable. If it’s greater than zero, the point shows up as a cluster.
The cluster can be displayed in any convenient way. Here’s an example:
for (const tile of tiles) {
    fetch(`https://api.test.service/?tile=${tile.tx}_${tile.ty}_${tile.tz}`)
        .then((res) => res.json())
        .then((points) => {
            points.forEach((p) => {
                map.addChild(p.properties.count ? new MMapFeature({/*...*/}) : new MMapFeature({/*...*/}));
            })
        });
}
There is a drawback, however. Breaking up clusters into separate map markers when users change the zoom level might seem too abrupt. This happens because the cluster is positioned midway between the most distant points rather than where most points are located.
A more “sophisticated” approach that factors in point density solves this issue.
Finding the mean coordinates
Below is a snippet for calculating the mean point coordinates. It adds up the coordinates of every point and divides the result by the number of points:
const [lngCenter, latCenter] = features.reduce(
        (acc, point) =>  [
            acc[0] + point.geometry.coordinates[0],
            acc[1] + point.geometry.coordinates[1]
        ],
        [0, 0]
    ).map(v => v / features.length);
Scale index
Another strategy for displaying points on a map is to only show the points that correspond to the current map zoom level. With this approach, all points get indexed on the server side based on the zoom level at which they appear.
For example, here are the scales used for categorizing post offices:
- World scale: Displays only the central postal hubs of a country
- Country scale: Displays the central postal hubs of cities and countries
- City scale: Displays the central post office of each district as well as the central postal hubs of cities and countries
- District scale: Displays the district’s largest post offices as well as everything displayed at the city scale
- Street scale: Displays all post offices, down to mailboxes and booths, as well as everything displayed at the district scale
This resolves the cluttering issue by displaying only a fraction of the points at any given zoom level.
Although all points are shown at the street level, we don’t have to render them all at the same time. They’re spaced far apart and either the bbox or the tile-based method keeps the data loading in check.
Popup points
Another solution for displaying a large number of points is utilizing WebGL or Canvas, which can render all points at once without performance issues. However, this method restricts the use of HTML and CSS. We’ll cover this in more detail in an upcoming article.
Meanwhile, here are several ways to improve user experience when dealing with numerous points on the map. Even when using the approaches mentioned earlier (except for clustering), overlapping points can still occur. A solution to this is adjusting the z-index of points when the user hovers over them:
Another option is to calculate the z-index on the server side. The data received from the backend includes the order field, which is calculated on the server based on the popularity of each location. It’s used on the client side to calculate the z-index of the points. When the user hovers over a different point to select it, the z-index of that point automatically increases:
let zIndex = 10000;

function App() {
    return <MMap location={LOCATION}>
        {/*...*/}
        {points.map((point, i) => (
            <MMapMarker
                {/*...*/}
            />
        ))}
        <MMapListener
            onMouseEnter={React.useCallback(({type, entity} = {}) =>  {
                if (type === 'marker') {
                    entity.update({zIndex: zIndex++});
                }
            }, [])}
        />
    </MMap>
}
Conclusion
Displaying thousands or more objects on the map simultaneously can cause performance issues. Removing the points that fall outside the visible map section solves the problem, but this technique may be ineffective at lower zoom levels.
Clustering is effective at various levels, but it requires iterating over all markers each time the map view changes. Using data loading based on tiles or bounding boxes can optimize the process by dividing the map into smaller segments. With this approach, more markers can easily be loaded in response to the user’s interaction with the map.
Each of these solutions has its own advantages and limitations, so the choice depends on the specific use case and performance requirements. The table below displays the different approaches and how they work in various scenarios:
| № | Solution | Objects | Outcome |
|---|---|---|---|
| 1 | Rendering all objects | 1000 | Already lagging after 1000 objects |
| 2 | Removing objects outside the visible area of the map | 10000 | Same as solution 1 at lower zoom levels |
| 3 | Clusterer | 100000 | Works at any zoom level but requires processing all objects each time the map view changes |
| 4 | Tiles | — | Works at any zoom level but requires an advanced server, the solution also needs to ensure each tile has no more than N objects |
| 5 | BBox | — | Works well at higher zoom levels but behaves like solution 1 when zooming out |
As demonstrated by the server-side clustering example, combining different approaches is a fairly effective strategy. For instance, this adaptive display algorithm can be paired with any of these solutions to enhance the user experience.
Stay tuned for updates as we continue exploring more insights and innovative mapping solutions.